By Alma Laney and Alison Bernstein
This post is the sixth in a series about transgenerational inheritance, epigenetics, and glyphosate that address questions raised by the publication of the paper, Assessment of Glyphosate Induced Epigenetic Transgenerational Inheritance of Pathologies and Sperm Epimutations: Generational Toxicology.
Are there problems with the methylation analysis?
When this paper was published, there was much ado on Twitter about the Venn diagram in Figure 3 and the lack of overlapping differential DNA methylation regions (DMRs) from generation to generation. These criticisms were only partially valid. An important point to remember when considering varied effects on different generations, the exposure for parents (P0 generation), children (F1 generation) and grandchildren (F2 generation) are all very different exposure routes and doses, so we would not necessarily expect to see similar epigenetic outcomes in these generations. Where we might expect to see similarities in epigenetic regulation, if transgenerational epigenetic inheritance is occurring, is from grandchildren (F2 generation) to great-grandchildren (F3 generation).
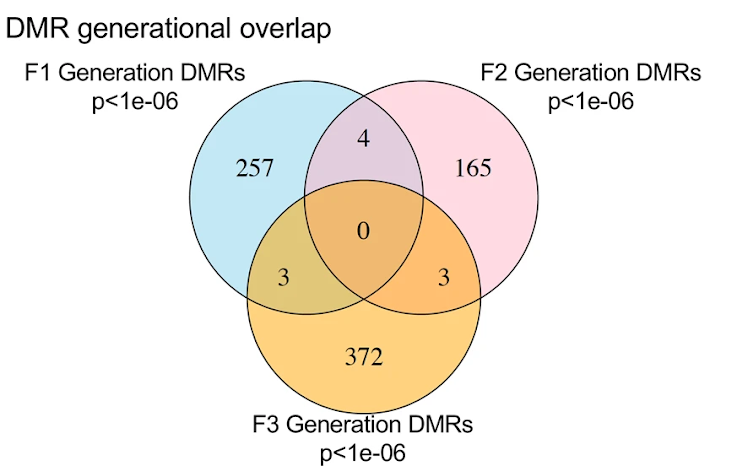
The lack of overlap between F1 and F2 makes biological sense. F1 is directly exposed in utero, while F2 is exposed as germ cells prior to fertilization and development. There are different exposures and there is no reason to assume that they will necessarily produce similar patterns of epigenetic changes. However, if the authors are concluding transgenerational epigenetic inheritance, the overlap between F2 and F3 is important.
The limited overlap here is consistent with the idea that only a limited proportion of the genome is available for transgenerational inheritance given that most of the genome undergoes a second wave of demethylation. Here, there are 3 identified DMRs showing transgenerational inheritance. Is this low? Is this high? We don’t really have a frame of reference to know. What we do know is that this small number of overlapping DMRs is fairly consistent with studies from this lab and others that have looked at transgenerational epigenetic inheritance. Characterization of these 3 DMRs as potential mediators of possible transgenerational inheritance seems to be the most intriguing finding here, but there is little to no exploration where these 3 DMRs are located and what they might be doing.
Given that there are only 3 potential loci for transgenerational inheritance, it would have been nice to see a biological confirmation to show that these are not 3 false positives (which is still possible even after applying the false discovery rate cutoff as they did). An examination of whether these are hyper- or hypo-methylated in F2 vs F2 would also have been useful and typical information to provide. Finally, a discussion of their potential biological role based on what genomic regions would be more interesting and informative than that data provided.
Technically, their methods for methylation analysis are standard. MeDIP-Seq is a commonly used method and the bioinformatic tools they used are appropriate. However, it’s unclear if they have adequate statistical power and given the phenotypic heterogeneity and it’s also unclear what effect the pooling of sperm from multiple animals would have on the outcomes.
In addition, the figures they have chosen to present the data are not very informative.
- In Figure 3, it is standard to report a table of the number of DMRs identified. Figure 3D is the infamous Venn diagram of Twitter fame that we discussed above.
- Figure 4 tells us very little except that DMRs are located across all chromosomes as expected, but there is really no useful information to be gleaned from these figures.
- Figure 5a is a permutation analysis which can be used in tests for differential methylation patterns across multiple generations to confirm that these DMRs are real, but the specifics of this analysis are not reported in the methods and we did not find the script provided with all the other scripts.
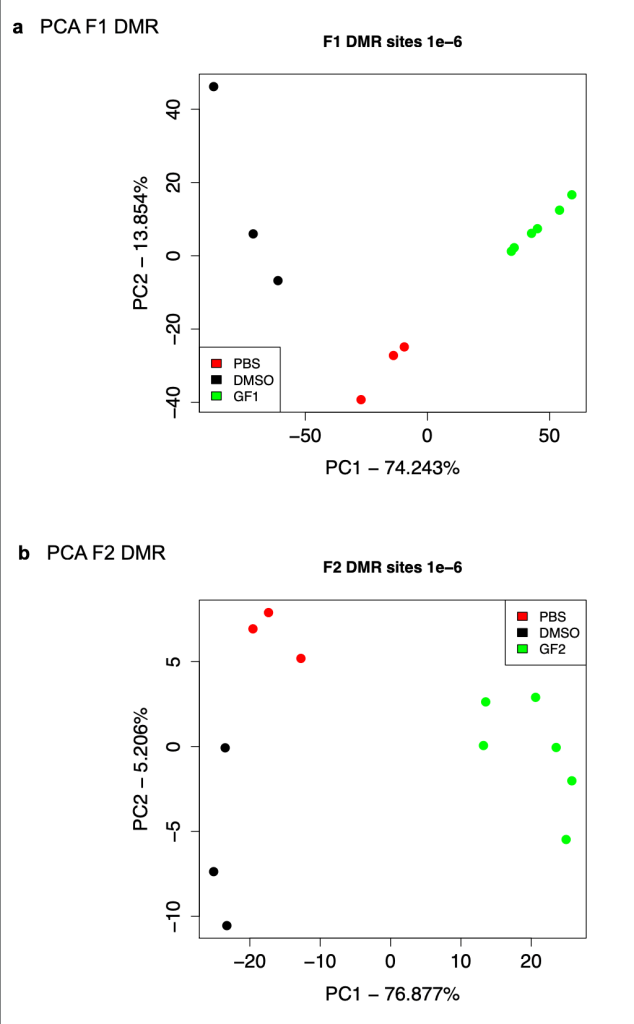
- Figure 5b includes the PCA analysis for F3 discussed earlier. The text for this figure states that the PCA for DMSO controls and PBS controls in both the F1 and F2 generations are similar, but, as shown above, when one actually looks at those, it’s not clear that they really are similar.
- Figure 6 shows a very high-level gene ontology analysis, which is a way to begin to understand what functions might be affected in a given set of genes. Gene ontology is only the first step of exploring methylation results and is not very informative, partly because the gene ontology terms listed in Figure 6a are too high level.
Not following up on the 3 DMRs that are potential candidates for actual transgenerational epigenetic inheritance seems like a missed opportunity. Overall, this seems to be a cursory and incomplete analysis of the very extensive characterization of DNA methylation that they did.
View the other parts of our series on transgenerational epigenetic inheritance:
- Transgenerational Epigenetic Inheritance and Glyphosate: Do we need to think of the grandchildren? (Introduction)
- Part 1: What is transgenerational inheritance?
- Part 2: Guidelines for studying epigenetic inheritance
- Part 3: Is the dose of glyphosate appropriate?
- Part 4: The problem of founder effects
- Part 5: Statistics
- Part 6: Methylation analysis (this post)
- Conclusions
